What is Global warming?
It is a highly debated environmental topic the debate is about the mechanism for global temperature increases, not that they are rising. Is it human induced? Or is it the natural cycle of the earth? Maybe a combination of both. This page is dedicated to display the other side of global warming issues.
Editor's note: As a scientist I am committed to educate, this page does not deny the possibility of human impacts of increasing carbon dioxide in the atmosphere and global temperature increase. However there are many other natural environmental mechanisms that affect global temperature and I am going to focus on a few of them.
The image below represents the Global Warming also known as the greenhouse effect, and why it is necessary for life to exist. The planets atmosphere traps the radiation from the Earth (the sun's rays heat the earth, and then the Earth emits long wave radiation that is trapped by the atmosphere). If this did not occur life as we know it could not exist. This is called Global Warming. Enhanced Global Warming is the proper name for the global temperature increases that some scientists are proposing.
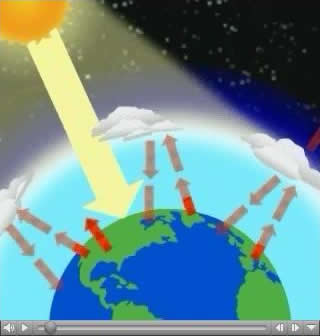
Click here to watch this video
Enhanced global warming is very controversial, and many research grants are given to study this phenomenon. Below are some images of the past climate of planet earth. (note that there are many similarities in today's temperatures)
Note that the temperature at 125,000 years ago is comparable with the current temperature (actually it is a little more). The temperature is also comparable at about 250,000 years ago. It looks like we have a cycle going on here. But what is the major changes with in those 100,000 to 125,000 year cycles? It also looks like there are cycles with in cycles, and there are. This brings me to the next set of data.
Eccentricity is the change in the elliptical orbit around Earth (occurs approximately every 100,000 years) also known as Milankovitch cycles This is thought to be one of the main contributors for the ice house intervals.
The tilt (obliquity) of the earth (41,000 years) Change of the tilt of the earth, typically changes 2 degrees total. Goes from 22.5 degrees to 24.degrees, right now we are in the middle at 23.5 degrees.
The wobble (precession) (approximately every 20,000 years) the wobble of the planet on the axis changes. (for example when you spin a top and it is wobbling slightly) (This is why ancient egypt was a wet and rainy compared to dry now, the precession changed the monsoons)
All three of these can be seen in the first graph that we see, the eccentricity, obliquity and precession. Upon careful observation you can clearly see these cycles. (here is some more data)
The data on the above figure shows that the overall temperature in the last 5.5 Million years has gone down (lets see the next graph).
This graph shows the las 65 million years, look at the temperature, it is going steadily down.
This graph represents the temperature fluctuations in the last 542 million years. Can you see any patters? Can you explain why there is so many temperature fluctuations? The answer is planet Earth is called the dynamic Earth system (dynamic means a constant state of change) that is why the term normal is relative, and I really do not like to use it. There are many reasons for climate shifts. There have been over 30 different hypothesis proposed to explain the Ice House intervals (When there are polar ice caps). In fact, most of the 4.6 billion year existence of planet Earth there, were no polar ice caps. Yeah, this means the planet used to be a lot hotter. Look at the carbon dioxide levels of ancient Earth.

The current carbon dioxide levels now, are far below the levels throughout the history of the planet. So ask your self, what is global warming? If you go back and look at the first graph, you will see a global warming trend that began about 18,000 years ago. This marks the begining of the end of the most recent ice age. Since then, the overall global temperatures have been on the rise, and the ice sheets have been melting. 18,000 years ago is well before the industrialization era, before humans learned to cultivate, and before cities developed, just for a sense of time.
Click Here to read this article about global warming trends
Other Places to Visit
http://www.sciencebits.com/CO2orSolar
The Urban Heat Island Effect (coming soon)
More to think about!
- 11/28/2006 - Environment Canada says such low temperatures unusual for this time of year. The arctic deep freeze trapping Calgary is on track to break a 110-year-old weather record today, but the bitter cold is expected to ease in the coming days. With a forecast low of -31C today, Calgary could break the -27C record set on this day in 1896. But factoring in the wind chill, it will feel even colder to people who have to brave the elements, said Environment Canada meteorologist Ross Macdonald. It's even been too frosty to ski, with Canada Olympic Park shutting the hill yesterday in the name of safety. Spokesman Chris Dornan said, to his knowledge, it's the first year the weather has forced a November closure. "It's normally in January or February,"
Record-Low Temperatures Sweep Across Russia
by Gregory Feifer (NPR Radio) http://www.npr.org/
All Things Considered, January 20, 2006 · Russia is experiencing Arctic temperatures, which have closed schools and killed at least seven people in Moscow alone. Authorities are warning factories they may experience power cuts as the 50-year record-low temperatures are expected to continue.

A white Christmas no dream
22dec06
FORECASTERS are predicting the first white Christmas in Australia for more than 20 years, with the possibility of snowfalls on the central Tasmanian plateau and the higher peaks of the Snowy Mountains.
Monday is expected to be cold and wet across southeast Australia, providing the best possible present for thousands of beleaguered firefighters in Tasmania, Victoria and NSW.
"There might even be enough snow to make a snowman," Don White of the consulting firm Weatherwatch said.
The white Christmas was given a prelude in the NSW town of Armidale yesterday, with a summer hailstorm shutting down roads, bringing down powerlines, smashing windows and building hail drifts up to half a metre deep.
The Christmas story is reversed for the other side of the country. Perth is expected to be hotter than average, with temperatures set to soar towards 40C during the festive season.
Temperatures in Sydney, Melbourne and Hobart are predicted to be significantly below average. The wet and cool conditions will be the result of a low-pressure system in the Tasman pushing up winds from the south across the southeast of the country.
| © The Australian |